

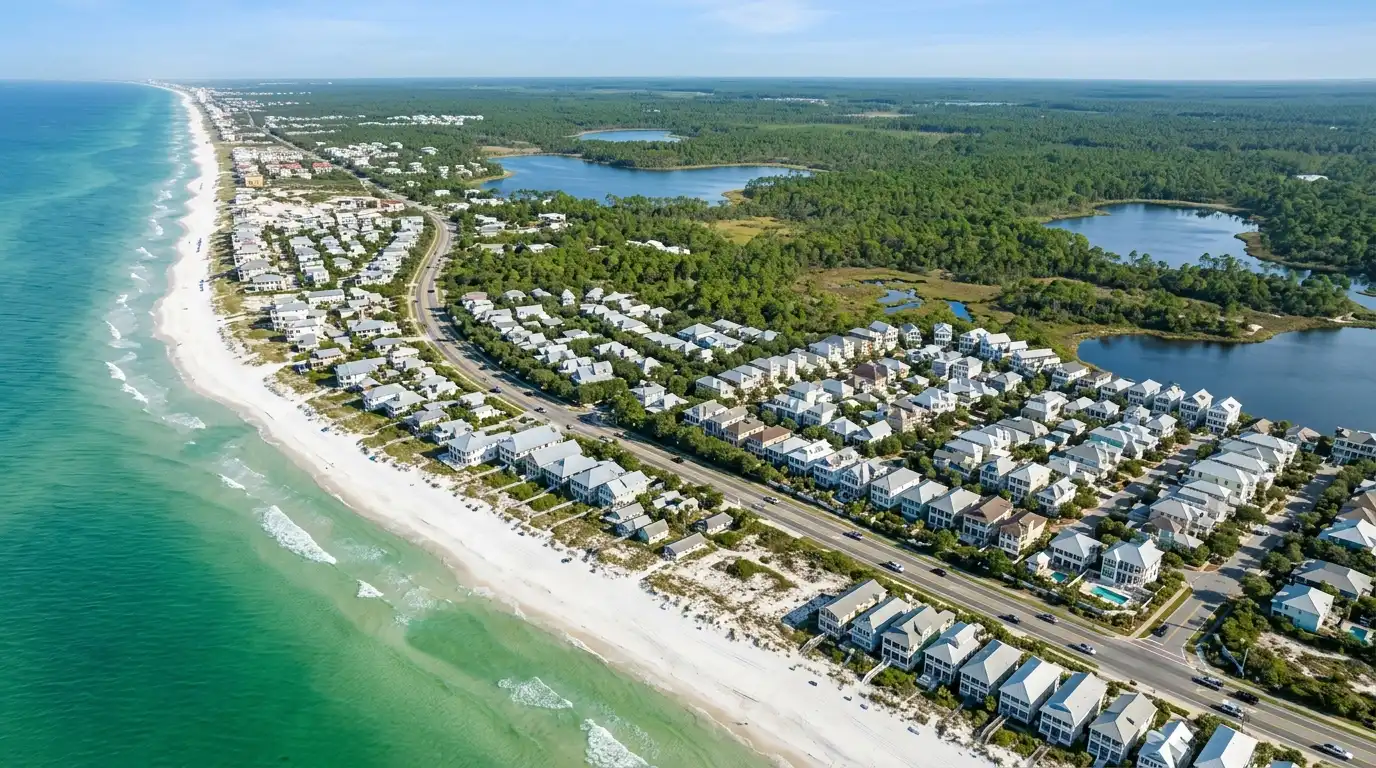
In the second quarter of 2026, the average single-family price across the eighteen areas The Beasley Group tracks ran from $588,692 in Panama City Beach to $9,320,172 in Alys Beach. Every area with public single-family sales came in below 100 percent on the list/sale price ratio, from 87.77 percent in Rosemary Beach to 96.06 percent in Alys Beach, and average single-family days on market in those areas ran from 81 in Seaside to 201 in Dune Allen.
This report covers the second quarter of 2026 for eighteen areas from Destin east along Scenic Highway 30A to Panama City Beach. It is the web edition of the quarterly market report The Beasley Group sends to clients as a flipbook, with the same figures, laid out so each community’s numbers can be read and quoted on their own. Single-family homes and condos/attached homes are reported separately because they behave like two different markets here.
Read the Sold column before the average price. In a community with two or four sales in a quarter, one Gulf-front home can move the average by millions, so the average describes those few homes, not the neighborhood. In Destin, Panama City Beach and North Santa Rosa Beach, where sales run into the dozens or hundreds, the average is far more stable. The list/sale price ratio compares what homes sold for with what they were listed at. Grayton Beach’s two single-family sales and one Seaside condo sale were off-market, which is why they show a 100 percent ratio and why Grayton’s days on market is not applicable.
Single-family homes, second quarter 2026
| Community | Average price | Sold | For sale | Average days on market | List/sale price ratio |
|---|---|---|---|---|---|
| Destin | $1,299,737 | 99 | 291 | 106 | 92.94% |
| Miramar Beach | $1,278,313 | 43 | 139 | 124 | 90.92% |
| Sandestin | $1,504,611 | 89 | 135 | 91 | 90.79% |
| Dune Allen | $1,937,838 | 33 | 103 | 201 | 89.54% |
| Gulf Place | $1,607,146 | 38 | 82 | 185 | 91.89% |
| Blue Mountain Beach | $1,784,120 | 25 | 61 | 151 | 88.03% |
| Grayton Beach | $1,525,000 | 2 | 27 | Not applicable (both sales off-market) | 100% (off-market) |
| WaterColor | $3,270,217 | 23 | 24 | 124 | 93.87% |
| Seaside | $3,057,362 | 4 | 5 | 81 | 94.12% |
| Seagrove | $2,224,459 | 62 | 147 | 172 | 91.47% |
| WaterSound* | $4,005,000 | 27 | 55 | 145 | 93.52% |
| Seacrest | $3,630,055 | 18 | 37 | 118 | 89.85% |
| Alys Beach | $9,320,172 | 16 | 35 | 91 | 96.06% |
| Seacrest Beach | $1,810,690 | 21 | 32 | 138 | 91.82% |
| Rosemary Beach | $5,425,000 | 2 | 12 | 157 | 87.77% |
| Inlet Beach | $2,268,244 | 17 | 70 | 118 | 90.18% |
| North Santa Rosa Beach | $1,011,319 | 176 | 306 | 115 | 94.37% |
| Panama City Beach* | $588,692 | 204 | 480 | 111 | 92.16% |
Source: The Beasley Group, Second Quarter Market Report 2026, community pages for all eighteen areas. Figures are reproduced as published, with two typographical corrections to the WaterColor and Seaside condo average prices. *WaterSound figures do not include WaterSound Origins. *Panama City Beach figures come only from the Central Panhandle Association of REALTORS MLS, per the report’s own note.
Condos and attached homes, second quarter 2026
| Community | Average price | Sold | For sale | Average days on market | List/sale price ratio |
|---|---|---|---|---|---|
| Destin | $611,477 | 143 | 462 | 138 | 91.37% |
| Miramar Beach | $740,375 | 81 | 394 | 139 | 90.95% |
| Sandestin | $571,737 | 20 | 101 | 231 | 90.94% |
| Dune Allen | $683,875 | 8 | 28 | 48 | 94.24% |
| Gulf Place | $1,400,312 | 8 | 16 | 122 | 92.28% |
| Blue Mountain Beach | $1,560,599 | 12 | 20 | 123 | 93.87% |
| WaterColor | $1,625,000 | 1 | 4 | 21 | 98.48% |
| Seaside | $1,425,000 | 1 (off-market) | Not reported | 1 | 100% |
| Seagrove | $708,833 | 27 | 28 | 181 | 92.5% |
| WaterSound* | $2,416,250 | 4 | 6 | 56 | 95.51% |
| Seacrest | $1,052,055 | 13 | 30 | 145 | 91.4% |
| Alys Beach | $4,068,335 | 12 | 17 | 21 | 95.79% |
| Seacrest Beach | $1,073,750 | 4 | 19 | 106 | 93.2% |
| Rosemary Beach | $2,403,500 | 3 | 17 | 69 | 96.13% |
| Inlet Beach | $912,500 | 2 | 5 | 9 | 91.76% |
| North Santa Rosa Beach | $445,270 | 37 | 39 | 92 | 95.79% |
| Panama City Beach* | $406,347 | 328 | 1,069 | 152 | 91.11% |
Source: The Beasley Group, Second Quarter Market Report 2026, community pages for all eighteen areas. Figures are reproduced as published, with two typographical corrections to the WaterColor and Seaside condo average prices. *WaterSound figures do not include WaterSound Origins. *Panama City Beach figures come only from the Central Panhandle Association of REALTORS MLS, per the report’s own note.
What the second quarter shows
The highest averages sit in central and east 30A
Alys Beach led single-family averages at $9,320,172 across 16 sales, followed by Rosemary Beach at $5,425,000 on only two sales, WaterSound at $4,005,000 across 27 sales (excluding WaterSound Origins), Seacrest at $3,630,055 across 18, WaterColor at $3,270,217 across 23, and Seaside at $3,057,362 across four. Alys Beach also led condos and attached homes at $4,068,335 across 12 sales. In our experience, homes in Alys Beach, Rosemary Beach, WaterColor and WaterSound can command luxury pricing even without direct Gulf frontage. Our guide to what makes a 30A home a luxury home explains those drivers one at a time.
Volume sits in Panama City Beach, North Santa Rosa Beach and Destin
By number of single-family sales, Panama City Beach recorded 204, North Santa Rosa Beach 176, Destin 99 and Sandestin 89. On condos and attached homes, Panama City Beach recorded 328 sales, Destin 143 and Miramar Beach 81. These are the markets with the deepest inventory as well: Panama City Beach had 480 single-family homes and 1,069 condos and attached homes for sale, and Destin had 291 and 462.
Days on market vary by more than three months across 30A
Among areas with public single-family sales, Seaside averaged 81 days on market, Sandestin and Alys Beach 91 each, and Destin 106. At the slow end, Dune Allen averaged 201 days, Gulf Place 185 and Seagrove 172. A long average is not a verdict on a community. It can reflect a handful of homes that were priced ahead of the market and sat, which is why we price every listing from very localized comparable sales. Our guide to selling a home on 30A covers how that works.
Negotiation room is real, and it differs by community
Single-family list/sale price ratios ranged from 87.77 percent in Rosemary Beach, on two sales, and 88.03 percent in Blue Mountain Beach to 94.37 percent in North Santa Rosa Beach and 96.06 percent in Alys Beach. Alys Beach carried both the highest single-family average price and the highest single-family ratio of any area with public sales. For condos and attached homes with public sales, the range ran from 90.94 percent in Sandestin and 90.95 percent in Miramar Beach to 96.13 percent in Rosemary Beach and 98.48 percent in WaterColor, where only one condo sold.
Grayton Beach barely traded in public
Grayton Beach recorded two single-family sales in the quarter, both off-market, at an average of $1,525,000, with 27 single-family homes listed for sale. Two sales is too small a sample to call a trend, but in a quarter with 27 homes on the market, both of the sales that did happen in one of the oldest communities on 30A happened privately. That is why relationships and off-market sourcing matter to buyers who want Grayton specifically. Our Grayton Beach buyer’s guide and our explanation of how off-market, Private Exclusive and Coming Soon sales differ cover both halves of that.
Why a single “30A average price” does not exist
Scenic Highway 30A is not one market. Within a few miles, a buyer moves between old beach cottages along narrow, unpaved alleys and old-plat streets in Grayton Beach, planned towns with their own architectural codes and beach arrangements in Seaside, WaterColor, Alys Beach and Rosemary Beach, and bayside neighborhoods toward Choctawhatchee Bay. A blended average across all of them describes none of them. That is why this report, like the flipbooks it comes from, is split by community and by property type, and why we read the sale count next to every average.
Community boundaries matter for the same reason. WaterSound, for example, is a group of distinct neighborhoods at very different price points, and the second quarter figures here exclude WaterSound Origins. Seacrest and Seacrest Beach are separate areas: Seacrest Beach is a planned community of its own. When a report pulls data by area, drawing those lines correctly decides what the numbers mean.
Where to find the full quarterly reports
The Beasley Group publishes this report every quarter. The most recent edition is always available as a flipbook here: The Beasley Group’s most recent market report. The second quarter 2026 edition covered on this page is here: Second Quarter 2026 Market Report. For current listings, see our market reports page.
Frequently asked questions
What was the average home price on 30A in the second quarter of 2026?
There is no single 30A average worth quoting, because the communities are priced very differently. In The Beasley Group’s Second Quarter 2026 Market Report, average single-family prices in the 30A communities ranged from $1,525,000 in Grayton Beach (two off-market sales) and $1,607,146 in Gulf Place to $5,425,000 in Rosemary Beach (two sales) and $9,320,172 in Alys Beach.
Which 30A community had the highest average home price in Q2 2026?
Alys Beach. The Beasley Group’s Second Quarter 2026 Market Report shows an average single-family price of $9,320,172 across 16 sales and an average condo or attached-home price of $4,068,335 across 12 sales, the highest in both categories among the eighteen areas the report tracks.
How long does it take to sell a home on 30A?
In the second quarter of 2026, among 30A areas with public single-family sales, average days on market ranged from 81 in Seaside and 91 in Alys Beach to 172 in Seagrove, 185 in Gulf Place and 201 in Dune Allen, per The Beasley Group’s Second Quarter 2026 Market Report. Within any one community, we price from very localized comparable sales.
Do homes on 30A sell below asking price?
On average, yes. Every area with public single-family sales in the second quarter of 2026 recorded a list/sale price ratio below 100 percent, from 87.77 percent in Rosemary Beach to 96.06 percent in Alys Beach. The only 100 percent figures came from off-market sales in Grayton Beach and a single off-market condo sale in Seaside.
What was the average home price in Destin in the second quarter of 2026?
The Beasley Group’s Second Quarter 2026 Market Report shows an average single-family price of $1,299,737 in Destin across 99 sales, with 106 average days on market and a 92.94 percent list/sale price ratio, and an average condo or attached-home price of $611,477 across 143 sales, with 138 average days on market.
How many homes sold in Grayton Beach in the second quarter of 2026?
Two single-family homes, both sold off-market, at an average price of $1,525,000, according to The Beasley Group’s Second Quarter 2026 Market Report. The same report shows 27 single-family homes for sale in Grayton Beach and no condo sales. Two sales is a small sample, so the average describes those two homes, not the community.
Do the WaterSound numbers include WaterSound Origins?
No. The Second Quarter 2026 report states that its WaterSound figures do not include WaterSound Origins. WaterSound is a group of distinct communities at different price points, with WaterSound Origins inland, so read the report’s WaterSound averages as covering the WaterSound communities other than Origins.
Where does the Panama City Beach data come from?
Per the report’s own note, Panama City Beach figures come only from the Central Panhandle Association of REALTORS MLS, and no Panama City Beach data is drawn from the Emerald Coast MLS. Panama City Beach is in Bay County, which the Central Panhandle Association of REALTORS serves.
How often does The Beasley Group publish market reports?
Every quarter. The team sends clients a community-by-community market report as a flipbook each quarter, and keeps a most-recent-edition flipbook link that updates automatically when the next quarter is released. This page is the web edition of the Second Quarter 2026 report.
Related guides from The Beasley Group
- What Makes a 30A Home a Luxury Home? The Seven Factors Behind the Price
- Selling a Home on 30A: How to Price It, When to List, and How to Sell a Home That Rents
- Living in Grayton Beach, Florida: A Buyer’s Guide to Old 30A
- Waterfront Property on 30A and in Destin: Gulf-Front, Gulf-View, Lake, Bay and Harbor Compared
- Buying a Second Home on 30A: How Visitors Become Owners and What to Decide First
- Market reports and current listings
- What is my 30A home worth?
Want the numbers for your street?
A community average is a starting point. We pull the comparable sales for your specific home, your part of the community and your property type, and show you where it would price today.
Ask The Beasley Group for a pricing review
Social Cookies
Social Cookies are used to enable you to share pages and content you find interesting throughout the website through third-party social networking or other websites (including, potentially for advertising purposes related to social networking).